Farmers reported just under 18 million acres of cover crops in the 2022 Census of Agriculture — single-digit penetration of U.S. cropland, which is the honest baseline for any regenerative transition plan. A workable transition sequences practices over about three years, budgets each one separately, and treats the documented yield-drag and cost years as a capital phase with an expected payback window, not as an instant cost reduction. Farm Press Theme publishes information, not financial advice; agronomic claims below cite extension and USDA sources.
What is actually in a regenerative transition?
The USDA Natural Resources Conservation Service frames soil health management around a documented set of principles: minimize disturbance, keep the soil covered, maintain living roots, and diversify the rotation. In row-crop practice those translate into four operable changes: reducing tillage, seeding cover crops after harvest, lengthening and diversifying rotations, and integrating livestock where feasible.
None of these is a single decision; each is a multi-year change of system. That is why operators who succeed tend to transition fields or a fraction of acres first, building a record on their own ground before the whole farm carries the practice.
How should year one be run?
Year one is measurement and first trials, not conversion. The documented sequence:
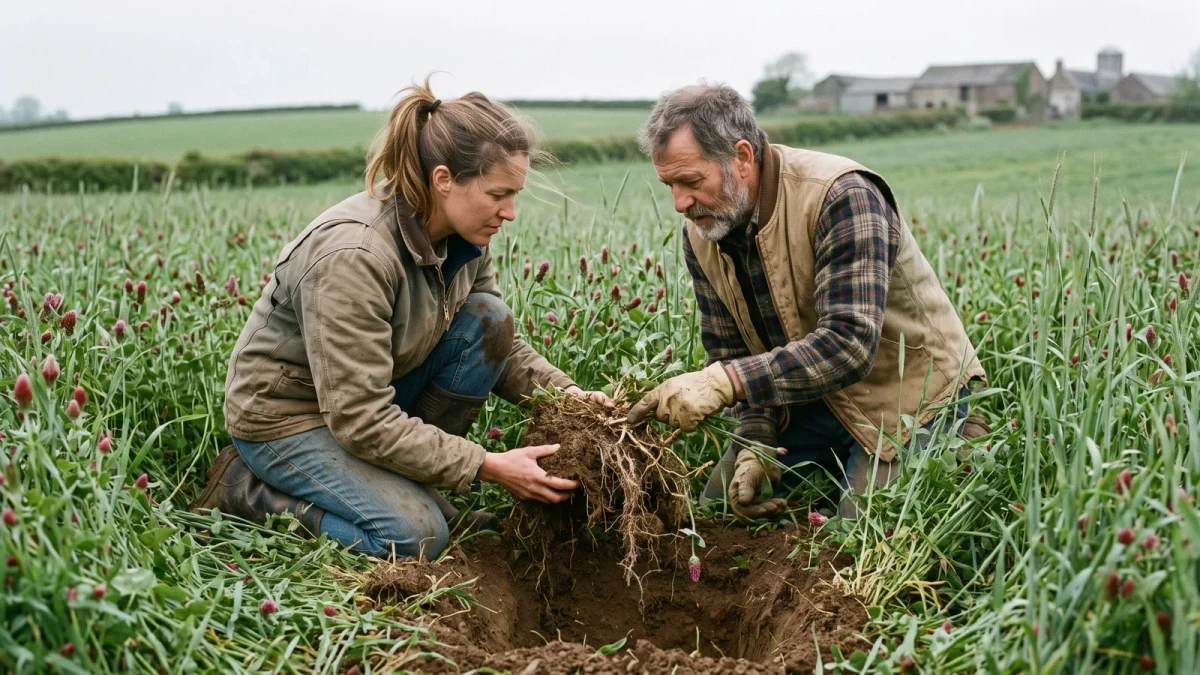
- Soil benchmarking — organic matter, infiltration, compaction — so change is provable against a baseline.
- One or two representative fields into cover crops after harvest, species matched to the cash crop that follows.
- A reduced-tillage pass plan trialed where residue management allows.
- Costs recorded per practice, per acre: seed, seeding operation, any termination product.
The year-one economics are deliberately written as a cost: university trial summaries consistently place cover crop seed and seeding in the tens of dollars per acre with no offsetting yield benefit in the establishment year. The budget question is what the farm can spend on its soil's balance sheet while the cash P&L absorbs it.
What changes in years two and three?
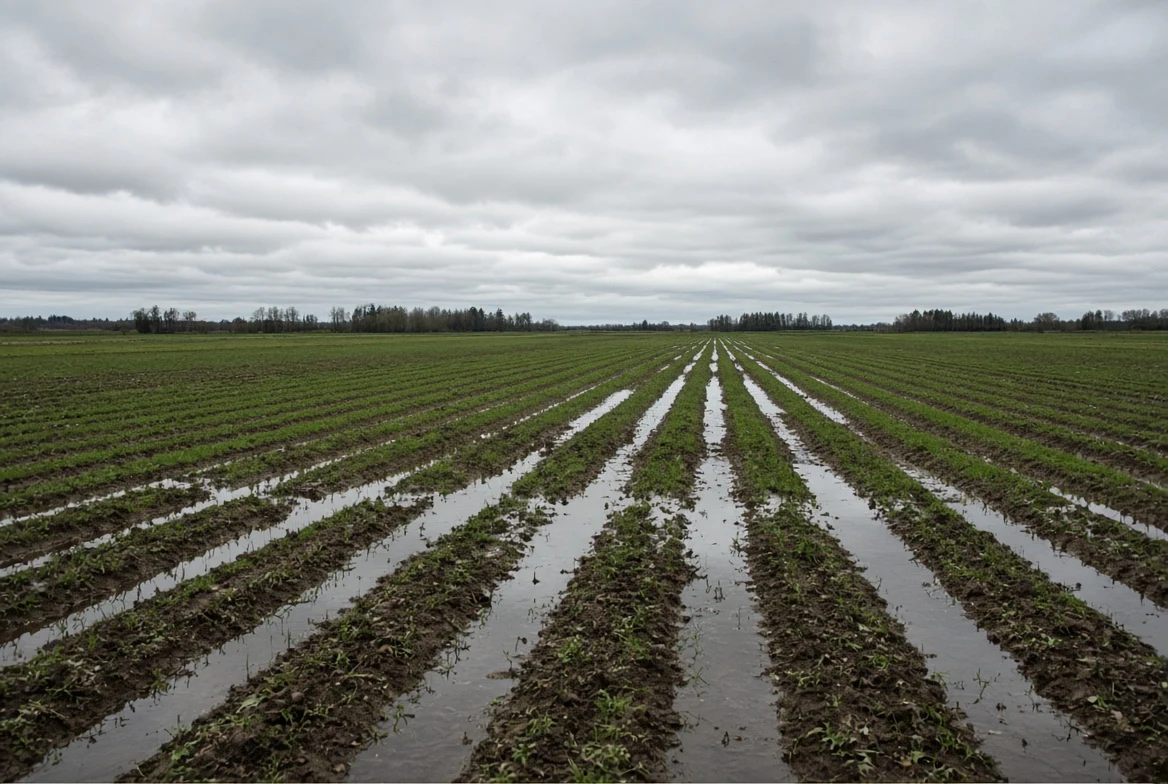
Year two scales the trial blocks and adds rotation diversity — a small grain or a broadleaf where the operation's equipment and markets allow. This is the year the documented risks concentrate: termination failures and wet springs strain planting windows on cover-cropped acres, and extension guidance is emphatic about termination timing ahead of a following corn crop. Yield drag, where it appears, is most documented in the first years of cover cropping ahead of corn; nitrogen management on cover acres is the operative lever, and extension recommendations commonly include a starter nitrogen adjustment at planting.
Year three extends practices to most planned acres and begins the honest accounting: yield comparisons against the year-one baseline, input trend lines for fuel and tillage passes, and — where programs apply — documented payments.
What do the transition years cost and return?
Costs are the verifiable part: cover crop seed and seeding at tens of dollars per acre per year, savings from eliminated tillage passes, and any yield deviation measured on the farm's own records. Returns arrive on three documented clocks. Agronomic: soil structure and water infiltration improve over multiple seasons per NRCS soil-health program reporting, which shows up as resilience in dry years rather than as a yield bump. Financial: USDA working-lands and conservation programs — EQIP and the Conservation Stewardship Program — pay cost-share on many of the same practices, and NRCS state offices publish current payment schedules. Market: premiums exist only where a verified buyer pays them, and those contracts are quoted, not assumed.
What are the documented failure modes?
Four recur in extension case work and program reporting:
- Whole-farm conversion in one season, outrunning the operator's learning curve on termination timing.
- Cover crops ahead of corn without nitrogen adjustments, compounding the documented early-year yield drag.
- Equipment mismatch — no reliable seeding method for late-window cover establishment.
- Budgeting the transition on assumed premium markets that were never contracted.
The three-year sequence exists to keep each of these small enough to correct.
How should the plan be evaluated at the end?
Against the year-one baseline, per field: yield trend, input cost trend, and soil measurements repeated on the same schedule. Operators who program payments should count them as what they are — transitional cost-share, not permanent revenue. The transition has succeeded when the practice set holds its yields, lowers a documented cost line, and no longer needs the program payment to clear the budget.
Frequently asked questions
How many acres of cover crops are there in the U.S.?
Just under 18 million acres were reported in the 2022 Census of Agriculture, released February 2024 — meaningful adoption, but still a small share of total U.S. cropland, and concentrated in certain regions.
Does regenerative farming raise or lower yields?
Transitions commonly show a yield drag in the first years of cover cropping ahead of corn, which extension nitrogen-management adjustments address. Over multiple seasons, documented gains show up mainly as stability — better infiltration and resilience in dry years — rather than as higher peak yields.
Is financial help available for the transition?
Yes. USDA NRCS programs such as EQIP and the Conservation Stewardship Program pay cost-share on cover crops, reduced tillage, and rotation diversification, with current payment schedules published by state offices. Cost-share is transitional support, not permanent revenue.
Should the whole farm convert at once?
Extension guidance and program experience favor staged transitions: representative fields first, three years of records, then scale. Whole-farm conversion in one season concentrates termination and equipment risks at exactly the point of least experience.