Irrigation on the High Plains costs producers in two currencies, energy for pumping that rises with every foot of lift, and aquifer decline that in parts of western Kansas has averaged roughly a foot of water-table drop per year for decades, per Kansas Geological Survey monitoring of the Ogallala portion of the High Plains aquifer. USDA's Census of Agriculture counted around 55 million irrigated acres nationally in 2022, with the High Plains remaining the country's largest contiguous irrigated region.
Pumping costs are site-specific: they depend on depth to water, energy source, and system efficiency, so the figures here are documented ranges with sources and dates, not quotes.
Why is the Ogallala the defining constraint?
The High Plains aquifer, whose Ogallala formation underlies parts of eight states from Nebraska to Texas, holds fossil water that recharges slowly. Since pre-development irrigation in the mid-20th century, the Kansas Geological Survey has documented cumulative water-table declines of well over 100 feet in heavily pumped portions of western Kansas, with smaller declines in the northern High Plains and Nebraska, where thicker saturated thickness and stream connection behave differently. Saturated thickness, the water-bearing depth of the aquifer, determines both how much a well can pump and how many years of pumping remain.
The decline is uneven by county and even by section, which is why irrigation economics in the region is fundamentally a local question. Two neighboring farms can face different well yields, different lift depths, and different trajectories.
What goes into the cost of an acre-inch?
Extension irrigation budgets, including work at Kansas State University and Texas A&M AgriLife Extension through 2025, break pumping cost into the same components. Depth to water sets the lift, and lift sets the energy: diesel, electricity, or natural gas engines each carry a cost per acre-inch that climbs directly with pumping depth and pressure requirements. Older, less efficient wells and poorly maintained pumps push the cost per acre-inch higher. Maintenance and well work add lumpy periodic costs.
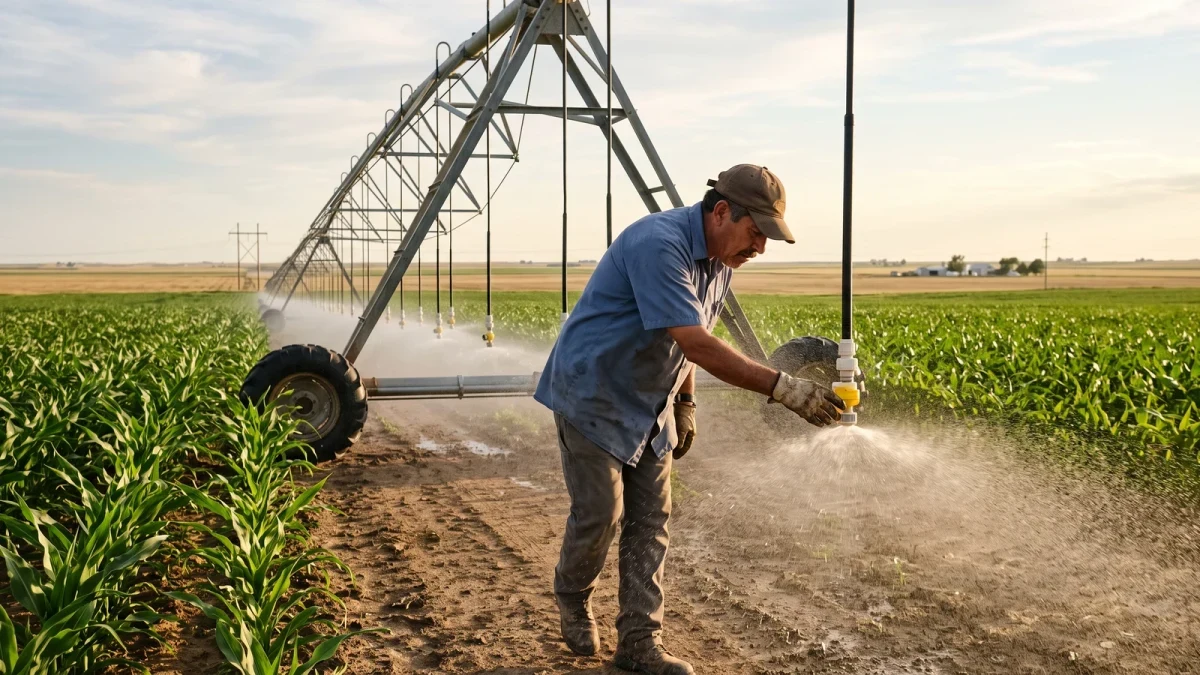
The documented pattern across the region: as water tables fall, producers apply less water per acre, convert to more efficient systems, and shift acreage to lower-water crops. Center pivots with drop nozzles and, increasingly, subsurface drip irrigation on the highest-value acres reduce losses per applied inch, but efficiency does not create water; it stretches what the well can produce.
How do crop choices change with the water math?
Water demand per acre differs sharply: full-season corn in the southern High Plains can require substantially more applied water than sorghum, wheat, or cotton in the same climate, and that gap is why crop mix has shifted across Kansas, Oklahoma, and the Texas Panhandle over recent decades. Extension budgets consistently show the regional pattern: as pumping costs rise and well capacity falls, acres move from thirsty crops to drought-tolerant ones, and some marginal ground returns to dryland or enrollment in conservation programs.
The operator's calculation is gross return per acre-inch applied: a lower-yielding crop that needs less water can out-earn corn when energy cost per inch and declining well capacity are priced in. University extension decision tools from the region are built precisely around that ratio.
What is being done about the decline?
Policy responses vary by state. Kansas Local Enhanced Management Areas (LEMAs) and Water Conservation Areas, established under state law in the 2010s, allow producers in a district to voluntarily agree to reduce water use in exchange for flexibility, and the first prominent LEMA in northwest Kansas documented reductions in water use over its initial multi-year span, per Kansas Department of Agriculture and KGS reporting. Nebraska regulates pumping through natural resources districts. Federal programs, including USDA EQIP, cost-share on irrigation efficiency and water conservation practices, with rates set by state.
The documented tension, noted by both university economists and state agencies, is that efficiency gains alone do not guarantee aquifer savings if the saved water is used to irrigate more acres, a point any operator weighing a system upgrade should build into the plan.
How should an operator budget irrigation for 2026?
The documented sequence from extension irrigation economists: measure depth to water and well capacity, get the energy cost per acre-inch for your own fuel source and lift from an extension calculator, budget the crop's water requirement for a normal and a dry year, and compare gross return per acre-inch across candidate crops before locking the mix. Producers inside a LEMA or considering one should price the agreed use reduction against the flexibility gained.
| Cost driver | How it moves the bill | Operator lever |
|---|---|---|
| Depth to water (lift) | More feet, more energy per acre-inch | Well placement, crop water demand |
| Energy source | Diesel, electric, gas cost per unit differ | Rate schedules, engine conversion |
| System efficiency | Losses per applied inch vary by system | Drop nozzles, maintenance, drip on high-value acres |
| Well capacity | Falling yield caps acres irrigated | Crop mix, deficit irrigation, dryland transition |
Frequently asked questions
How fast is the Ogallala aquifer declining?
It varies sharply by location. The Kansas Geological Survey has documented average declines of roughly a foot per year in parts of western Kansas, with cumulative losses over 100 feet since pre-development in the heaviest-pumped areas, while the northern High Plains, including much of Nebraska, shows smaller declines.
What is the biggest cost of irrigation on the High Plains?
Energy for pumping, which scales with depth to water and system pressure. As water tables fall, lift increases and each acre-inch costs more, making energy the line item that ties aquifer decline directly to the farm budget.
Does switching to drip or drop nozzles save water?
Efficient systems reduce losses per applied inch and often improve yields per inch, per university irrigation research. But efficiency does not create new water, and savings can be redirected to more acres, which is why regulators pair efficiency incentives with use targets.
Which crops use the least irrigation water?
Sorghum, wheat, and cotton generally need less applied water than full-season corn in the same southern High Plains climate, per extension budgets. The decision metric is gross return per acre-inch applied, not just yield per acre.
What is a LEMA in Kansas?
A Local Enhanced Management Area, created under Kansas water law in the 2010s, lets producers in an area jointly agree to reduce water use with flexible enforcement in return for conservation goals. The first northwest Kansas LEMA documented reduced water use over its initial term.