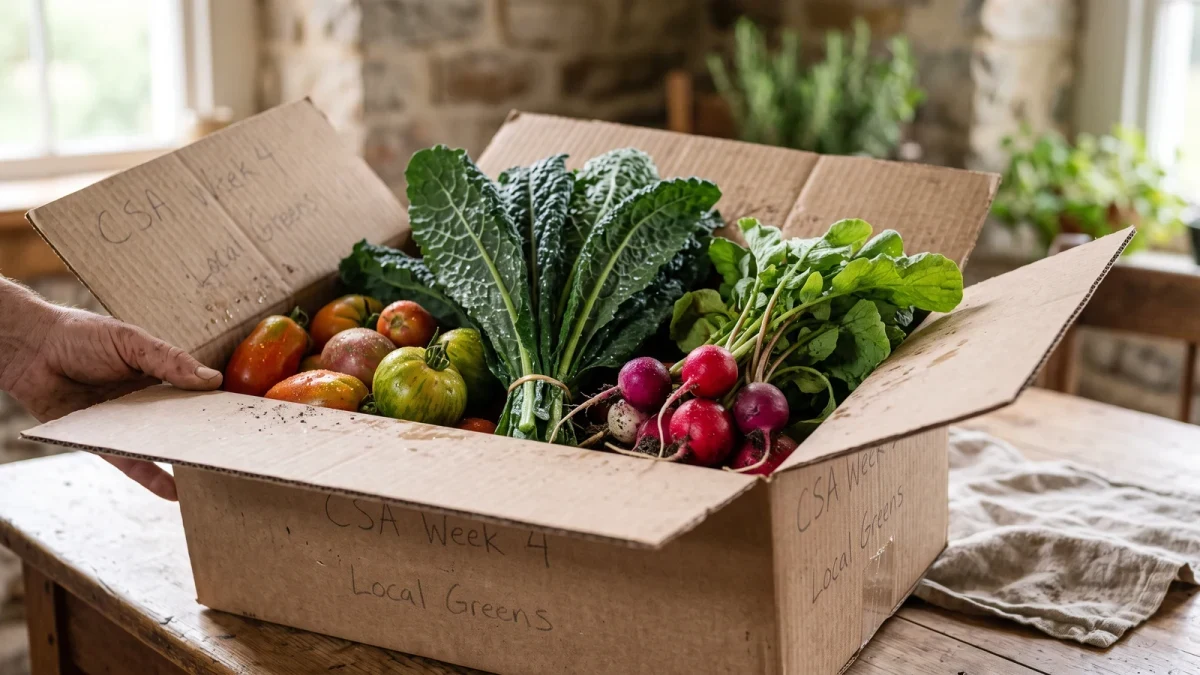
Some 116,600 U.S. farms sold $3.3 billion of food directly to consumers in 2022, up 16 percent from 2017, per the 2022 Census of Agriculture — a channel base big enough to compare seriously. The four main direct-to-consumer routes — farmers markets, community supported agriculture (CSA), on-farm stores, and online sales — differ sharply in margin structure, labor calendar, and volume ceiling, and the right choice tracks the operation's location, product mix, and staffing. Farm Press Theme publishes information, not financial advice; the comparison below rests on census and USDA program data.
What does each channel offer, structurally?
USDA's Agricultural Marketing Service maintains public directories across these channels — a sign of how established each has become. The structural differences:
| Channel | Typical margin position | Labor shape | Scale ceiling | Main risk |
|---|---|---|---|---|
| Farmers market | Retail price, minus stall fees and travel | Weekly peak, season-long | Capped by market traffic | Weather-driven attendance |
| CSA | Prepaid season revenue | Steady weekly fulfillment | Member base near farm | Season-long delivery obligation |
| On-farm store | Full retail margin | Fixed staffing hours | Location-dependent | Facility and overhead cost |
| Online / e-commerce | Retail minus shipping and platform fees | Year-round, order-driven | Shipping range | Fulfillment cost per order |
How do the margins actually differ?
Every direct channel captures the retail margin instead of the wholesale price, but the deductions differ. A farmers market sale pays retail minus stall fees, mileage, and a full day of staffing; USDA's directory data show thousands of markets nationwide, so fees and traffic vary by venue, and operators should benchmark per-market sales before committing to a season. CSA revenue arrives prepaid, which is the best cash-flow shape in agriculture, but carries the heaviest obligation: a defined share every week regardless of what the season does.
On-farm stores earn the full retail margin and cost the most in fixed overhead — building, staffing, insurance. Online sales extend reach beyond driving distance but surrender margin to shipping and platform fees that scale with every order; small average orders frequently lose money after fulfillment costs, which is why channel economics favor online for dense, shelf-stable baskets.
Which channel fits which operation?
Location first. Proximity to population centers raises the ceiling on markets, CSA membership, and agritourism-adjacent store traffic; remote operations lean online or on drop-point CSA models. Product mix second: perishable mixed vegetables suit markets and CSAs; meat, dairy, and value-added goods with shelf life suit online and on-farm stores, and they also interlock — a store or pickup point can serve online orders at no marginal shipping cost.
Staffing third. Markets consume Saturdays; CSAs consume a weekly fulfillment cycle; a store consumes fixed hours year-round. An operation should count its available labor honestly before stacking channels — the census counts farms selling direct, not the hours their owners worked.
How do channels combine, and what does USDA count?
The census growth to $3.3 billion in 2022 came largely from farms combining routes: market presence building a brand that feeds a CSA and an online store, with pickup consolidated. USDA AMS runs the Local Food Directories covering markets, CSAs, food hubs, and on-farm markets — free listings that put an operation in front of buyers searching by ZIP code, and the directories double as market-density research for anyone choosing a venue.
The combination logic is documented in local-foods program work: each additional channel raises the fixed cost burden slightly and the revenue ceiling a great deal, up to the labor limit. Past that limit, added channels subtract.
What should an operator measure to choose well?
Per-channel contribution, after every channel-specific cost:
- Revenue per selling hour, counting travel and setup as selling hours.
- Cost per transaction — fees, shipping, packaging, card processing.
- Retention: CSA re-up rate, online repeat-order rate, market regulars.
- Cash-flow shape: prepaid CSA dollars versus post-delivery market dollars.
Run each channel as its own line in the enterprise budget. The census number says the D2C channel base is large and growing; the per-channel numbers on your own books say which part of it belongs on your farm.
Frequently asked questions
How many farms sell direct to consumers?
The 2022 Census of Agriculture recorded 116,617 farms with $3.3 billion in direct-to-consumer sales, up 16 percent from 2017, released by USDA NASS in February 2024.
Which direct channel has the best margin?
On-farm stores earn the full retail margin but carry the highest fixed overhead. Markets pay retail minus fees and staffing days; CSA revenue is prepaid but obligates a season of weekly shares; online sales surrender shipping and platform fees per order. Net margin depends on volume per channel.
Does a CSA model guarantee income?
It guarantees prepaid revenue at the start of the season, not profit. The operation still owes members a defined weekly share whatever the weather does, so the model trades price risk for fulfillment risk.
Where can buyers find my direct-sales operation listed?
USDA's Agricultural Marketing Service maintains free Local Food Directories for farmers markets, CSAs, food hubs, and on-farm markets, searchable by ZIP code; listing an operation there is a documented, no-cost customer-acquisition step.