USDA's Economic Research Service forecast 2026 net farm income at $153.4 billion in its December 2025 farm income forecast — a year in which most operations will still face more capital demands than cash. A capital expenditure ranking discipline puts land, machinery, technology, and buildings into one queue scored the same way, and the documented method favors projects with short payback and capacity leverage over the emotionally urgent ones.
Farm Press Theme publishes information, not financial advice — this is an analysis of capital-budgeting mechanics applied to farm investments, not a recommendation on any purchase.
What framework ranks farm capital projects?
The same one used off the farm: payback period first, then return on the capital employed, with a required return set above the cost of debt. For each candidate project, write down incremental cash flow — the dollars the project adds or saves, with source and region for any benchmark figure — and divide the investment by that annual amount. Shorter paybacks survive bad years; long-payback projects only belong on operations with strong liquidity.
The queue works because it forces unlike projects into one currency. A grain bin, a tile package, a planter upgrade, and forty acres of land all become annual-cash-flow-per-dollar-invested, and they rank.
How do the big categories actually compare?
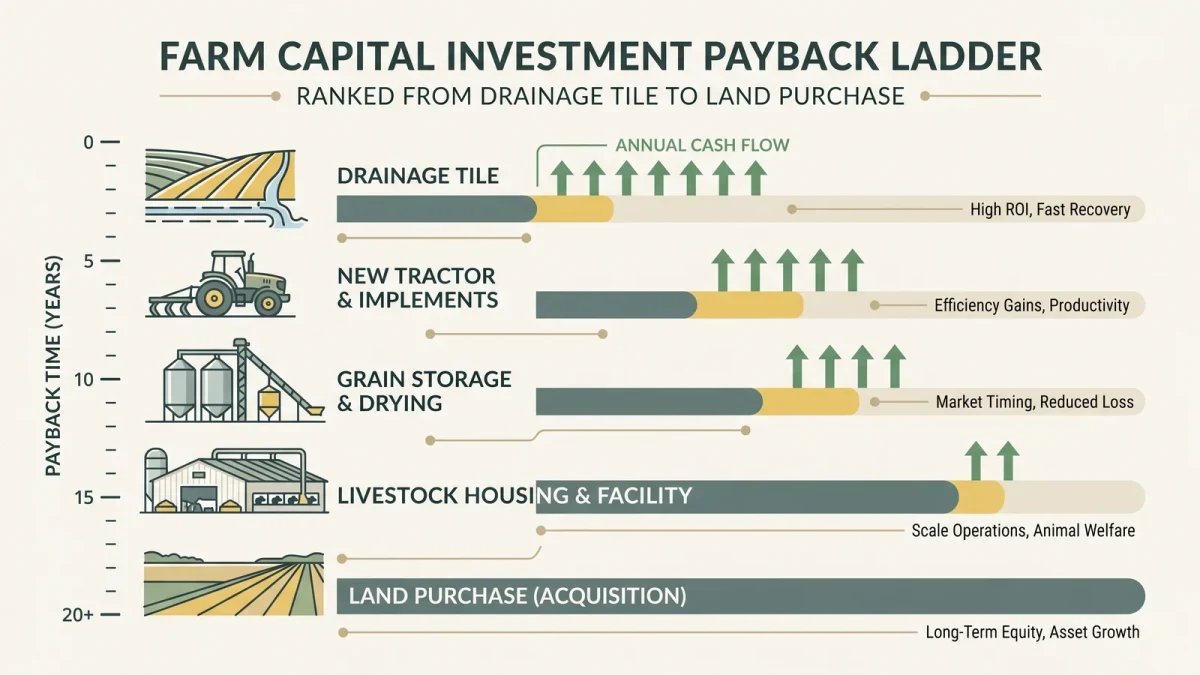
Broadly, from the documented cost and return structure of each:
| Category | Typical payback shape | Key risk |
|---|---|---|
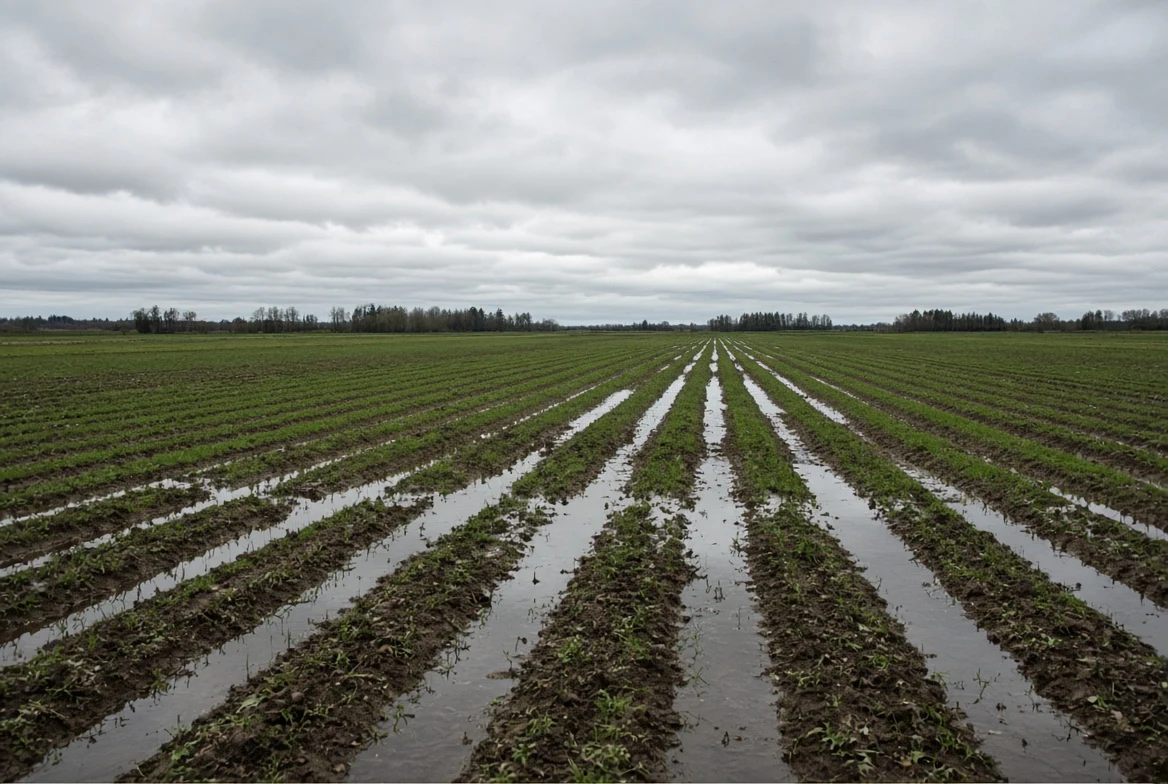
| Drainage tile | Documented yield response on wet pattern ground; multi-decade life | Only pays where wetness is the yield constraint |
| Grain storage | Marketing and drying savings accrue per bushel stored | Requires repeat volume and management |
| Machinery upgrade | Capacity, timing and repair-cost driven | Depreciating asset; acres must justify width |
| Precision technology | Input savings per acre where variability exists | Value scales with field variability |
| Land purchase | Appreciation plus annual return, longest horizon | Capital intensity crowds out all other projects |
Two documented qualifiers govern the whole table. Drainage responses hold only on fields where wetness limits yield — the payoff is regional and field-specific. Precision-technology paybacks scale with variability, the same qualifier that runs through precision-ag economics.
Which expenditures fail the ranking most often?
Two kinds. Capacity outruns: a machine whose width is justified by planted acres the operation does not yet have — the machinery cost per acre rises and no line of the enterprise budget improves. And status sequencing: buying the land parcel first because it came up for sale, then finding that the drainage, storage, and technology projects with five-year paybacks have no capital left. Land is rarely the wrong asset to own; it is simply the one that consumes every other project's funding, which is exactly why it sits last in a scarcity ranking rather than first.
How should debt shape the decision?
The lender's constraints are real and documented: leverage ratios, repayment capacity, and collateral. In a high-rate environment the required return on any financed project rises with the loan rate, which mechanically shortens the list of qualifying projects. A practical discipline: score every project at a required return set a couple of points above the current operating-loan rate, so the queue reflects what borrowed capital actually costs the operation this year.
Term structure matters as much as rate. Matching loan length to project life keeps annual payments aligned with the cash flow the asset generates; financing a five-year-payback technology package over fifteen years, or a multi-decade drainage investment over five, misstates what either project is doing to the balance sheet.
Cash purchases are not exempt — capital spent from reserves carries an opportunity cost equal to what that money would earn repaying debt or in the next project in the queue.
What does a working capital calendar look like?
A one-page annual routine:
- After harvest, list every candidate capital project with cost and projected incremental annual cash flow.
- Score payback and return; apply the required-return hurdle.
- Match the survivors against available cash, credit capacity, and dealer lead times for the coming year.
- Re-run the queue each year — rankings change with rates, acres, and the previous year's results.
The discipline's value is not the first-year ranking but the habit: every capital request stands in one line, scored one way, and the operation's scarce dollars go to the front of that line by arithmetic rather than by whoever asked most recently.
Frequently asked questions
How do you prioritize farm capital spending?
Rank every candidate project by payback and return on capital at a required return above your cost of debt, then fund from the top of the list within your cash and credit limits. Re-score the queue annually, because rates, acres, and results change the ranking.
Should land always come first?
Land is the longest-horizon, most capital-intensive purchase, so in scarcity it ranks last in a payback framework — not because it is a poor asset, but because it crowds out every shorter-payback project. Operations with surplus liquidity and a multi-generation horizon weight it differently.
What is the farm income outlook used here?
USDA ERS's December 2025 forecast put 2026 net farm income at $153.4 billion, roughly $1.2 billion below its 2025 estimate. The figure frames the capital climate; ERS revises its forecasts through the year.