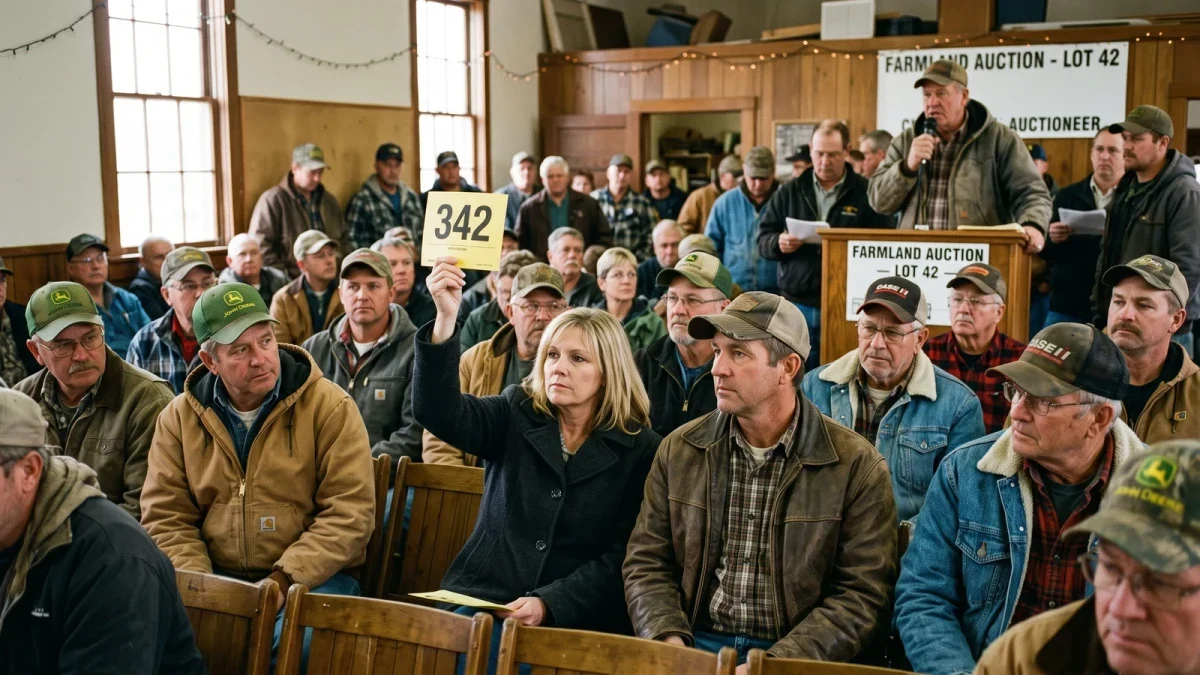
The average value of U.S. farm real estate reached $4,350 per acre in 2025, up $180, or 4.3 percent, from 2024 and the highest level on record, according to the USDA National Agricultural Statistics Service Land Values 2025 Summary released August 1, 2025. Average U.S. cropland value rose to $5,830 per acre, a 2.2 percent inflation-adjusted increase, per USDA Economic Research Service analysis of the same survey.
Farm Press Theme publishes information, not investment or financial advice. Every farmland figure in this analysis carries its source and date, and farmland is a local market: a national average blends Corn Belt ground that trades in five figures with Plains pasture that does not.
Where do farmland values stand after 2025?
The 2025 NASS survey, based on June 1 reference conditions, marked the fourth consecutive annual increase in the national farm real estate average, extending a run that began after 2020. Cropland at $5,830 per acre and farm real estate at $4,350 per acre both sit at nominal records, though inflation-adjusted gains have narrowed as the pace of appreciation slowed from the double-digit jumps of 2021 and 2022.
Pasture averaged roughly $1,920 per acre nationally in 2025, per the same NASS summary, and pasture values in several Plains and Mountain states have grown faster than cropland in recent years, supported by a cattle cycle that pushed ranchers to expand grazing base.
What drove the record, and is it still there?
Three forces did most of the work. First, strong net farm income years in 2021 through 2023 left many operators with cash and working capital to buy ground. Second, a limited supply of quality land reaching the market: land sales volume in most Corn Belt states stayed below long-run averages through 2024 and 2025, per university farmland surveys, including the annual Iowa State University Land Value Survey, which recorded modest further gains in 2025. Third, investor demand from institutions, individuals, and 1031 exchange buyers kept competing for row-crop ground.
What changed in 2025 is the income side. Row-crop commodity prices spent 2024 and 2025 well below their 2022 peaks, and USDA farm income forecasts through 2025 showed crop cash receipts under pressure. That squeeze explains why appreciation cooled to low single digits rather than reversing outright.
Which regions moved differently?
The NASS summary's state tables show the spread. Northern Plains and Corn Belt states posted the largest absolute cropland values, with Iowa and Illinois cropland averaging above $12,000 per acre in the 2025 data. Southern and Western states saw the fastest percentage growth in several cases, with Oklahoma farm real estate averaging $2,880 per acre, up 5.9 percent in a year. Dairy and specialty-crop regions followed their own commodity cycles rather than the row-crop pattern.
The regional lesson for operators: local land markets are driven by local rents, local yields, and local buyers, and a national outlook is a starting frame, not a price prediction.
What do interest rates change for 2026 buyers?
Farmland is a long-duration asset, so financing costs matter. Farm operating and real estate loan rates rose sharply in 2022 through 2023 and stayed elevated through 2025, per Federal Reserve agricultural finance surveys such as the Kansas City Fed's Agricultural Finance Databook. Higher rates raise the hurdle rate for leveraged purchases and cap what operators can pay per acre while keeping debt-service coverage.
For cash buyers, the competing question is opportunity cost: what farmland yields in rent and appreciation against other uses of capital. For sellers, the decision-relevant questions are timing, capital gains treatment, and whether a lease-back or installment sale fits the family's succession plan.
How should operators read the 2026 outlook?
Farm Press Theme does not predict land prices, and no credible source should be asked to. What the documented record supports is a frame: values entering 2026 are at nominal records, the income support under them has weakened, interest rates remain well above their 2010s levels, and the supply of land for sale remains thin. Those conditions have historically produced slower appreciation or flat-to-modestly-lower values in some regions, not a collapse, but the honest answer is that the balance varies by county.
Operators weighing a purchase in 2026 can stress-test the deal with documented numbers: the cash rent the tract can carry per the USDA NASS Cash Rents Survey, the financing terms actually available from their lender, and a downside budget built on 2025-level commodity prices rather than 2022-level ones.
| Measure (U.S. average) | 2025 value | Change vs. 2024 | Source |
|---|---|---|---|
| Farm real estate, per acre | $4,350 | +4.3% | USDA NASS Land Values 2025 Summary |
| Cropland, per acre | $5,830 | +2.2% (real) | USDA ERS farmland value series |
| Pasture, per acre | ~$1,920 | up modestly | USDA NASS Land Values 2025 Summary |
Frequently asked questions
What was the average U.S. farmland value in 2025?
Average U.S. farm real estate was $4,350 per acre in 2025, up 4.3 percent from 2024, per the USDA NASS Land Values 2025 Summary released August 1, 2025. Average cropland alone was $5,830 per acre, per USDA ERS analysis of the same survey.
Are farmland values expected to fall in 2026?
Farm Press Theme does not make price predictions. The documented picture entering 2026: record nominal values, weaker row-crop income, and elevated interest rates, a mix that slowed appreciation through 2025 rather than reversing it in most surveyed states.
Which state has the highest farmland values?
Corn Belt states lead. In the 2025 NASS data, Iowa and Illinois cropland averaged above $12,000 per acre, among the highest state averages. Values vary sharply within states, so county-level survey data beats state averages for decisions.
Does the USDA farmland value include buildings?
The $4,350 per acre figure is farm real estate value, which includes land and buildings. NASS also publishes separate cropland and pasture value estimates, which is why the cropland figure of $5,830 per acre differs from the all-real-estate average.
Where can operators check cash rents against land values?
The USDA NASS Cash Rents Survey, with 2025 county-level estimates released September 2, 2025, is the public benchmark. Comparing local rent to the tract price gives a gross yield that can be stress-tested against financing costs before any purchase.