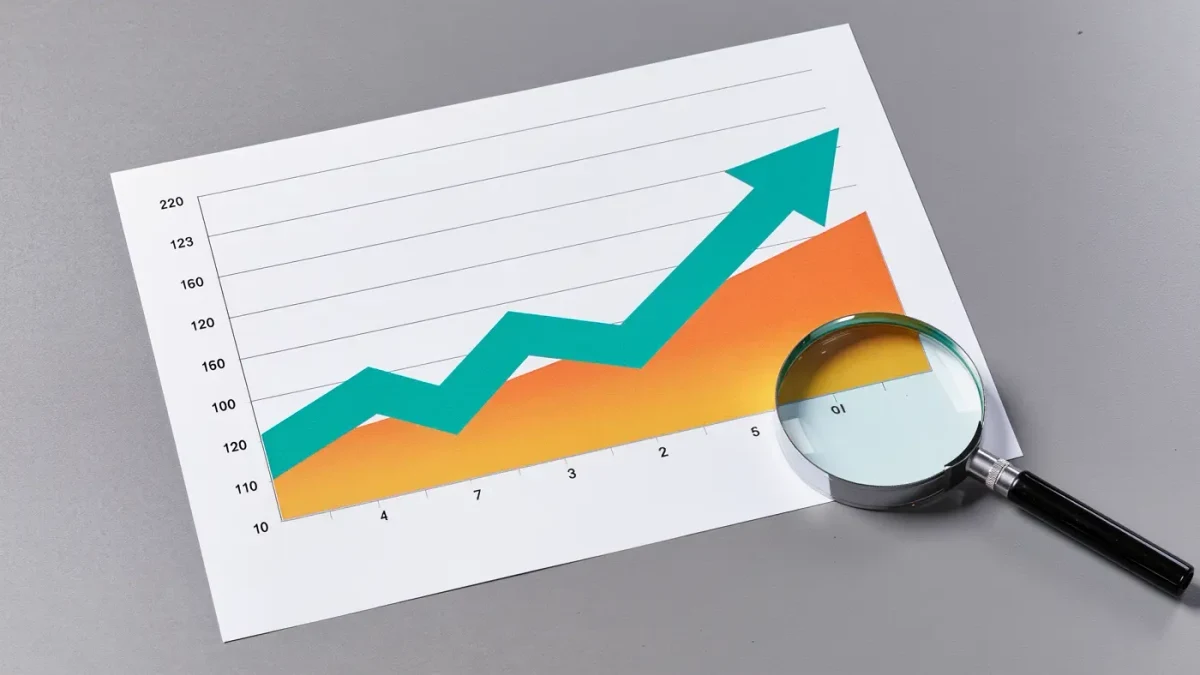
U.S. farm establishments received 11.8 cents of every dollar spent on domestically produced food in 2024, down from 12.1 cents in 2023, per the USDA Economic Research Service's food dollar series. The other 88.2 cents went to everything after the farm gate: processing, packaging, trucking, wholesale margins, retail labor, and energy. For grocery spending alone, the farm share was higher, at 18.5 cents.
This site publishes information, not marketing or financial advice, and nothing here tells operators when to sell. The food dollar numbers are an accounting of the supply chain, not a bargaining position. But the spread between farm prices and retail prices shapes how consumers read food inflation and how much of a price move at the shelf ever reaches a farm account. The series is worth understanding on its own terms.
What does the food dollar series actually measure?
The food dollar series is a USDA Economic Research Service data product that divides each dollar of consumer spending on domestically produced food among the establishments that contributed to it. It is built from industry accounts, not from tracing individual cartons of milk or crates of tomatoes. The farm share is the portion received by farm establishments as gross returns, and it moves with both farm prices and the cost of everything downstream.
The series is published annually with a lag; the 2024 figures, released in 2025, are the most recent as of January 2026. Two companion measures matter for reading it. The food-at-home farm share, 18.5 cents in 2024, covers grocery purchases. The food-away-from-home share, roughly 7 cents, covers restaurants, where labor and service take a larger slice of each dollar.
Why is the farm share so different for groceries and restaurants?
A restaurant meal is mostly service. Preparation, wait staff, rent, and administration absorb most of the check, so the raw ingredient cost, and therefore the farm share, is small. Grocery products carry processing, packaging, and retail costs too, but a smaller service layer, which leaves more of each dollar connected to the farm product itself.
That difference explains a pattern operators see regularly: when a commodity price moves sharply, grocery prices for that commodity respond more visibly than restaurant menu prices. The farm share of a carton of eggs is a larger fraction of the retail price than the farm share of a diner breakfast, so the same commodity shock shows up unevenly across the two channels.
Which costs make up the marketing bill?
The 88.2 cents beyond the farm in 2024 covered a long list of handlers. Food processing takes the largest single share of the non-farm dollar for food at home, followed by retail trade, wholesale trade, food services where applicable, and the cost buckets that cut across every stage: labor, packaging, transportation, energy, advertising, and the profits of each intervening business. The ERS reports these shares in both an industry-group breakdown and a primary-factor breakdown, and the two answer different questions.
The primary-factor view is the one that tracks inflation mechanics. When diesel, packaging materials, or processing wages rise, the cost lands in the marketing bill regardless of what farm prices do. That is why retail food inflation can persist after commodity prices ease, and why a falling farm share does not automatically mean farm receipts fell in dollar terms.
What widens or narrows the spread in a given year?
Two things move the farm share: farm prices and non-farm costs. When commodity prices rise faster than downstream costs, the farm share climbs, as it did in the commodity price surge of 2022. When farm prices soften while labor, transport, and processing costs keep rising, the share falls again, which is the pattern of 2023 and 2024 in the series.
The share also differs enormously by product. Foods with minimal processing, like fresh eggs or fresh produce in season, pass more of the retail dollar back to the farm than heavily processed foods, where manufacturing, packaging, and branding dominate the cost stack. A farmer selling into a fresh market and a farmer selling into an ingredient stream can face very different spreads on the same land.
What does the spread mean for marketing decisions?
The practical reading is about expectations. When the farm share is 11.8 cents of the all-food dollar, a 10 percent move in retail food prices only has to be matched by a much larger percentage move in farm-level prices to keep farm revenue constant, and it usually is not. Operators who sell into processed channels should expect retail price signals to arrive at the farm gate damped and delayed.
It also frames consumer conversations. When shoppers ask why farm prices fell while shelf prices did not, the food dollar series gives the documented answer: the shelf price mostly pays for work done after the farm. Farmers who sell direct, through farmers markets or farm stands, are effectively capturing part of the marketing bill themselves, which is why direct sales channels behave differently from commodity channels in the same market year.
How should operators use the series?
Treat it as a benchmark, not a forecast. The series describes the whole domestic food economy, and no single operation matches the average. Its value is in direction and scale: whether the farm share is rising or falling, and how big the non-farm cost stack is relative to the farm portion. For contract negotiations or enterprise budgeting, the local basis, the regional processor's offer, and the specific buyer's margin structure matter more than the national average.
The numbers to carry forward from the 2024 release are simple. Farm share of the all-food dollar: 11.8 cents, down from 12.1 in 2023. Grocery: 18.5 cents. Restaurants: about 7 cents. Everything else, 88.2 cents on average, pays the chain between the field and the plate, and that chain, not the farm, sets most of what a shopper pays.